I've created a variety of reports and infographics utilizing data visualization to simplify complex data points, summarize numerical results and tell a story.
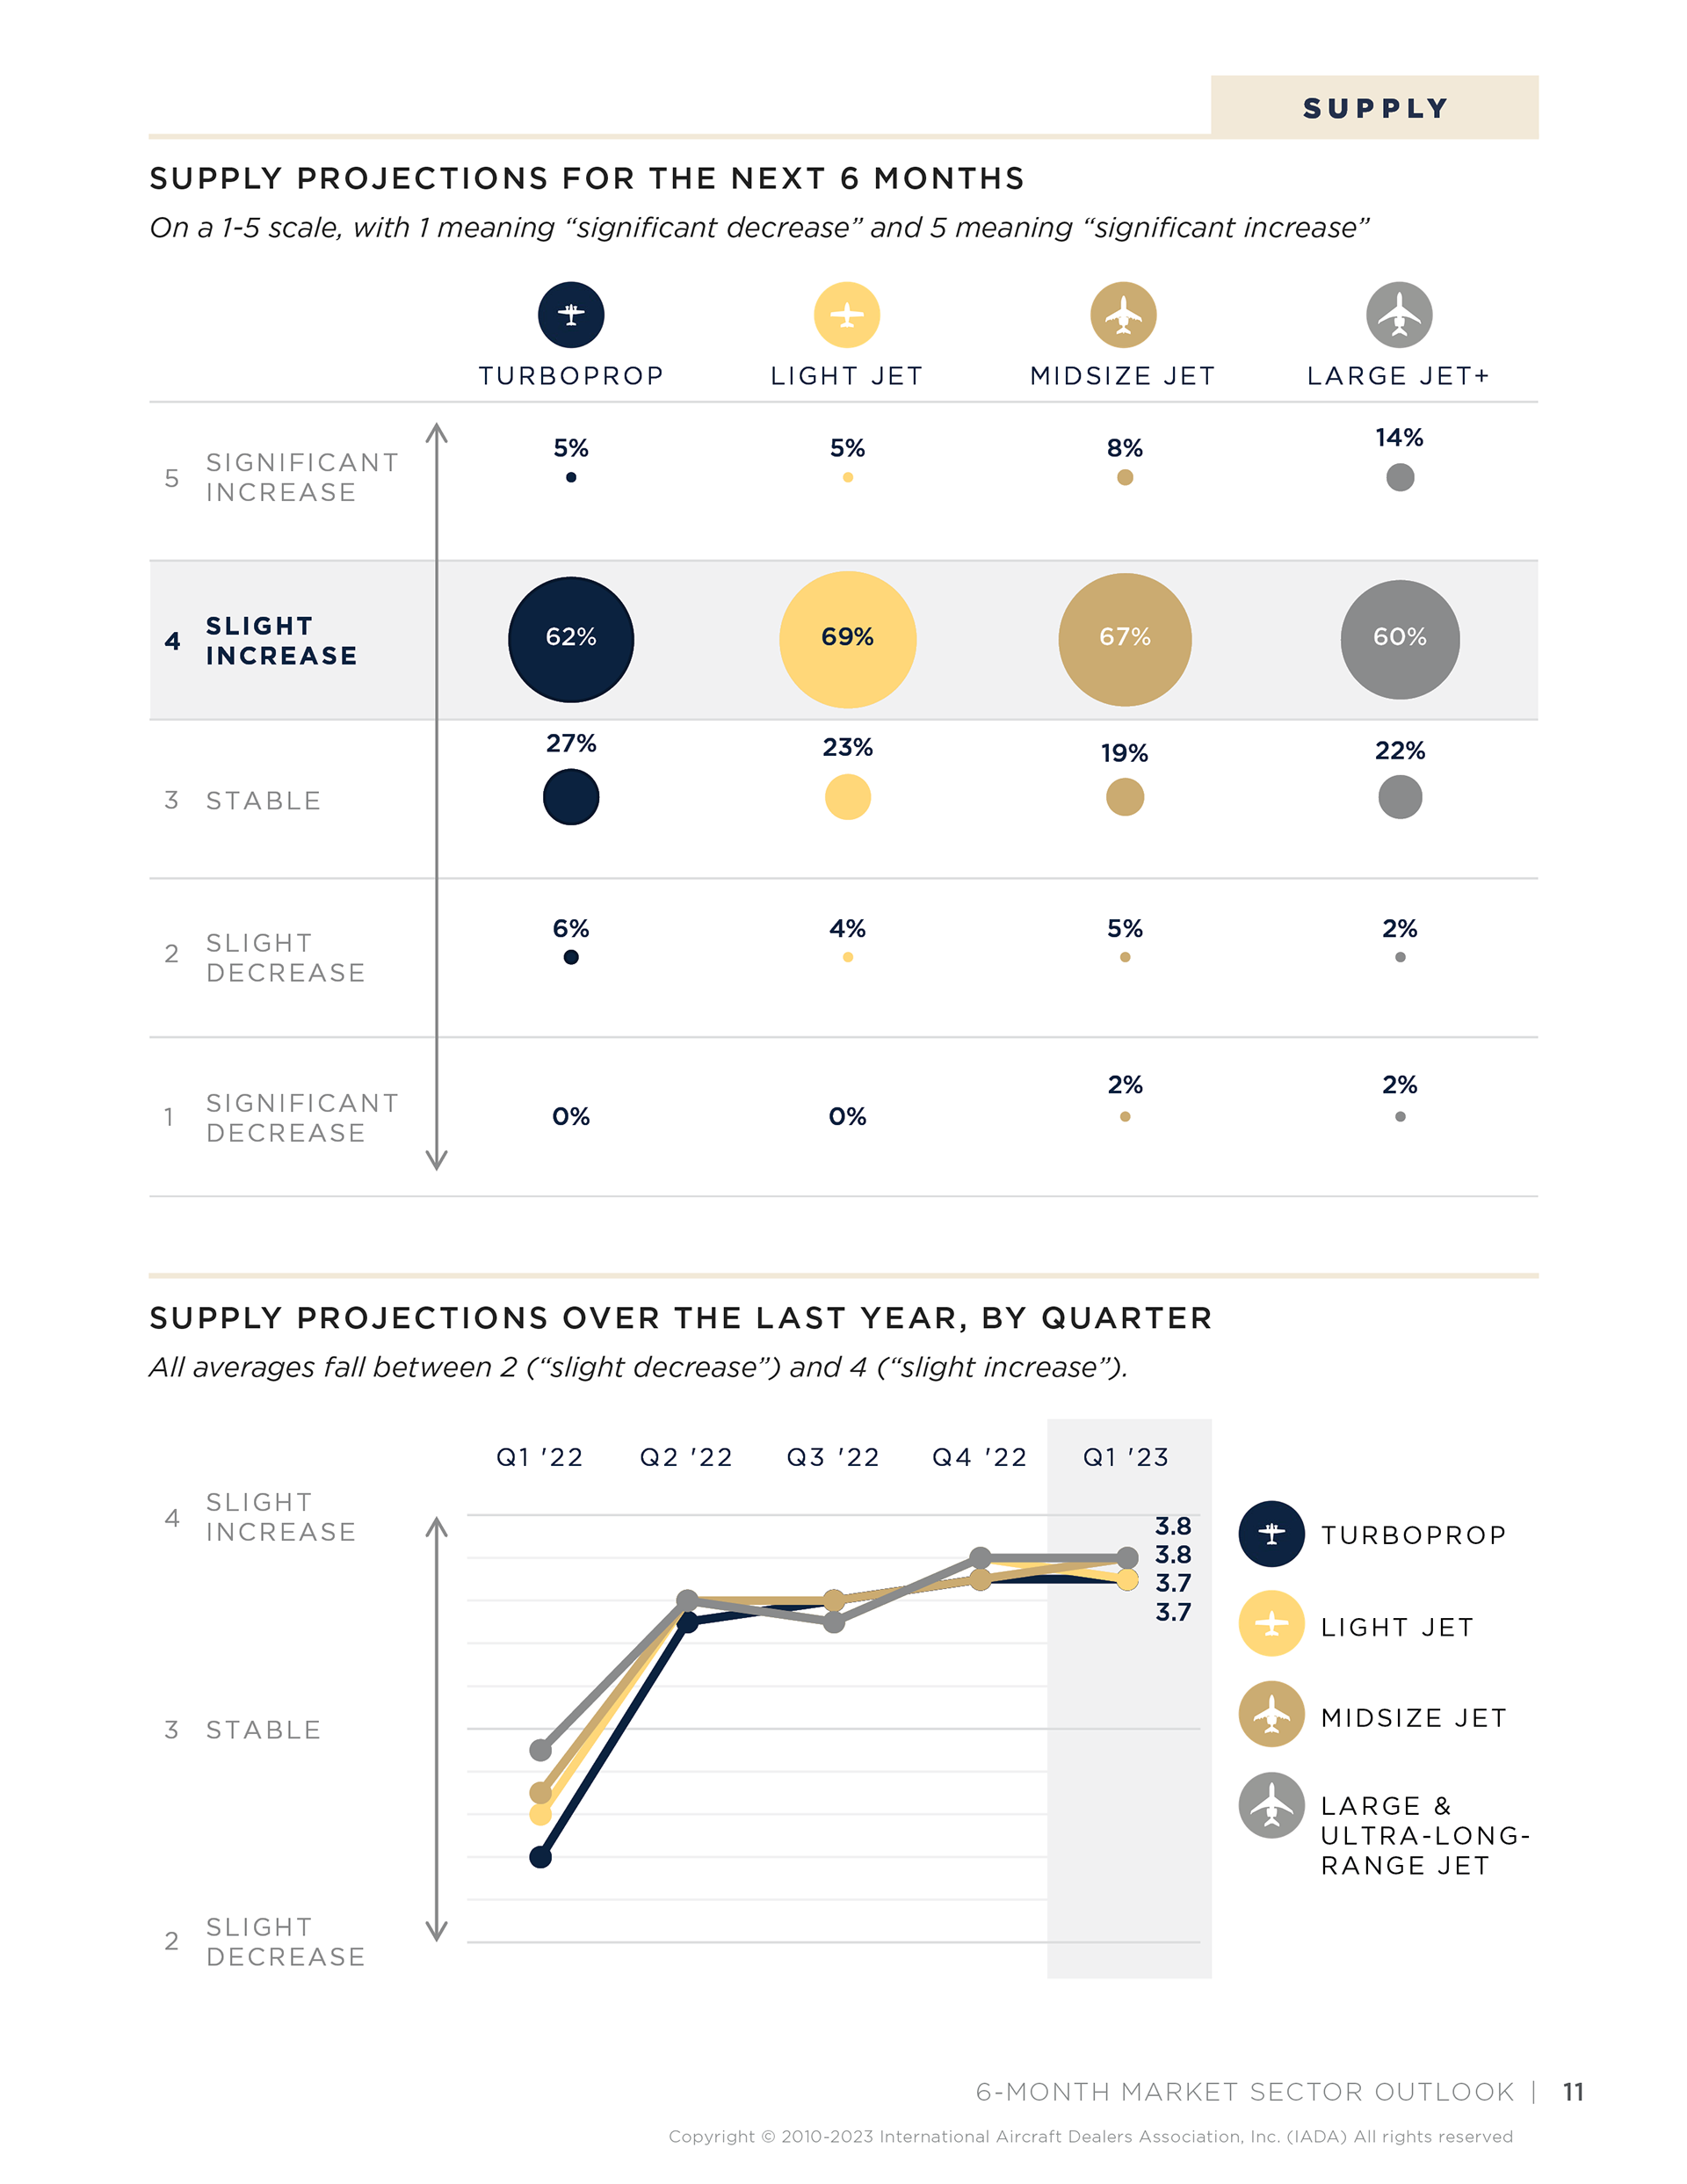
IADA Quarterly Market Report
Expert analysis and insights from the International Aircraft Dealers Association


Customer Journey Maps
Data visualization of Enterprise, Executive, Professional, Accountable process for a company doing an inventory of their services.


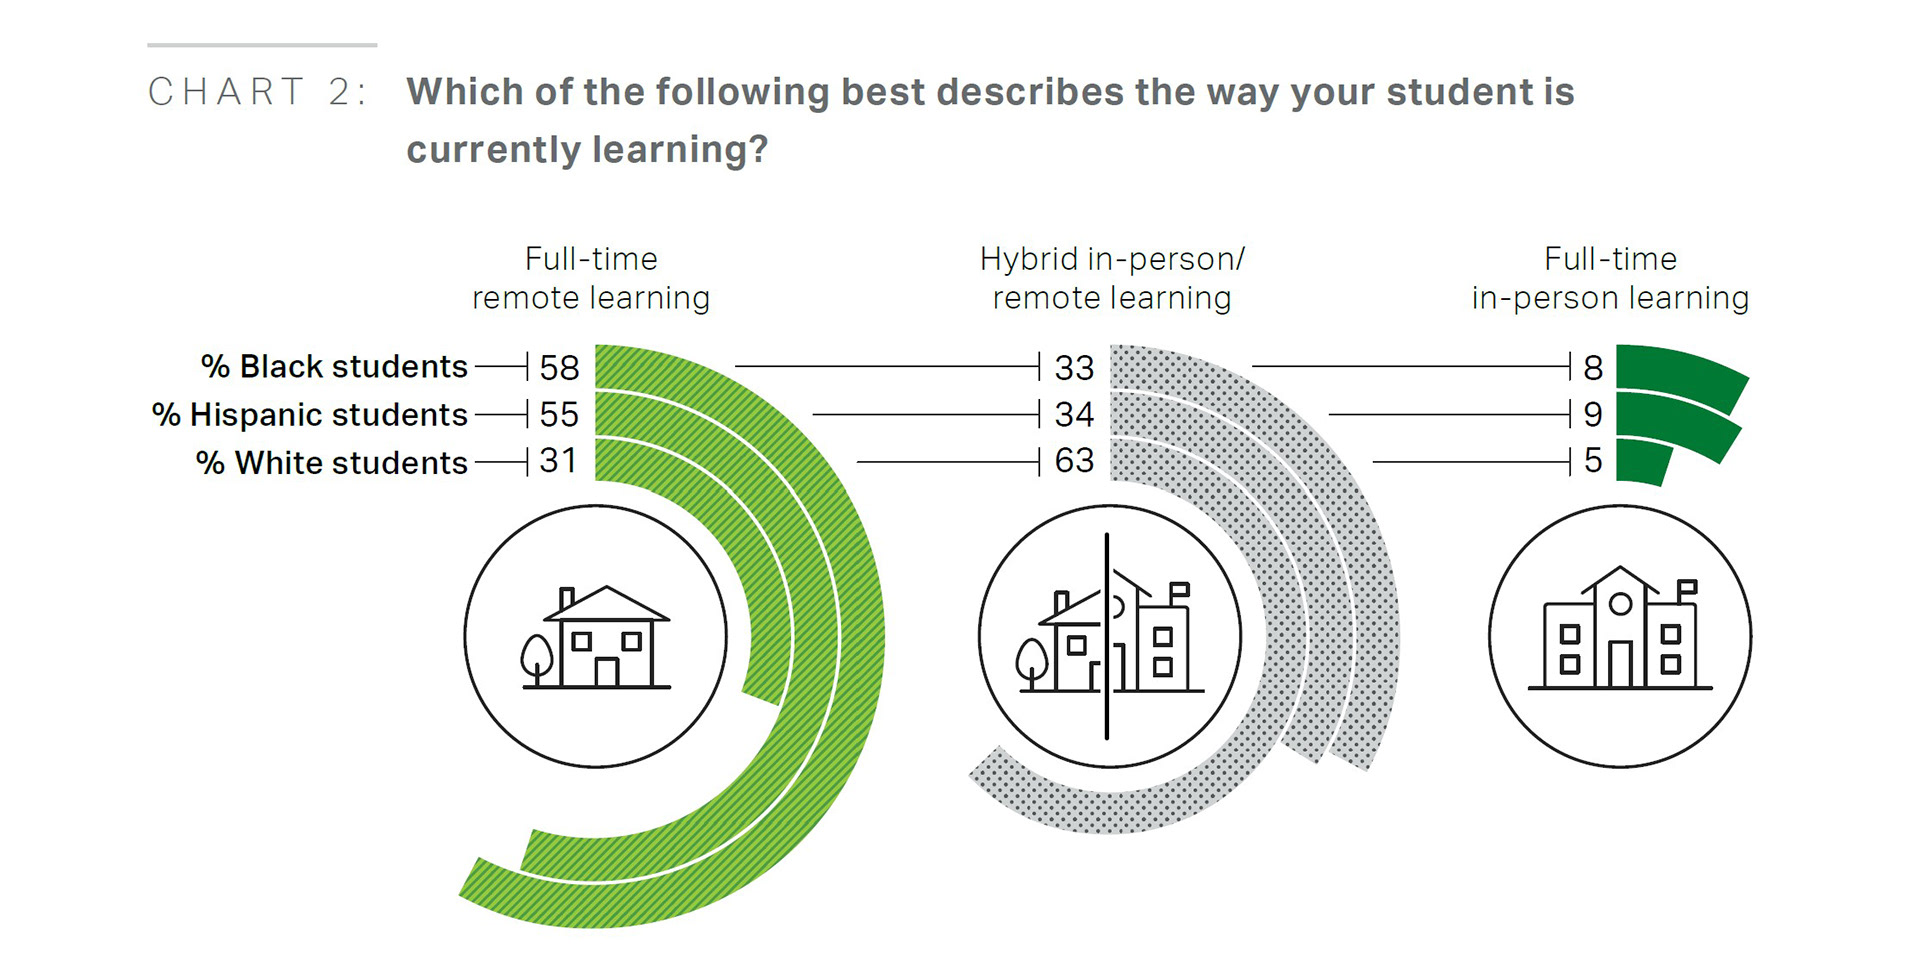
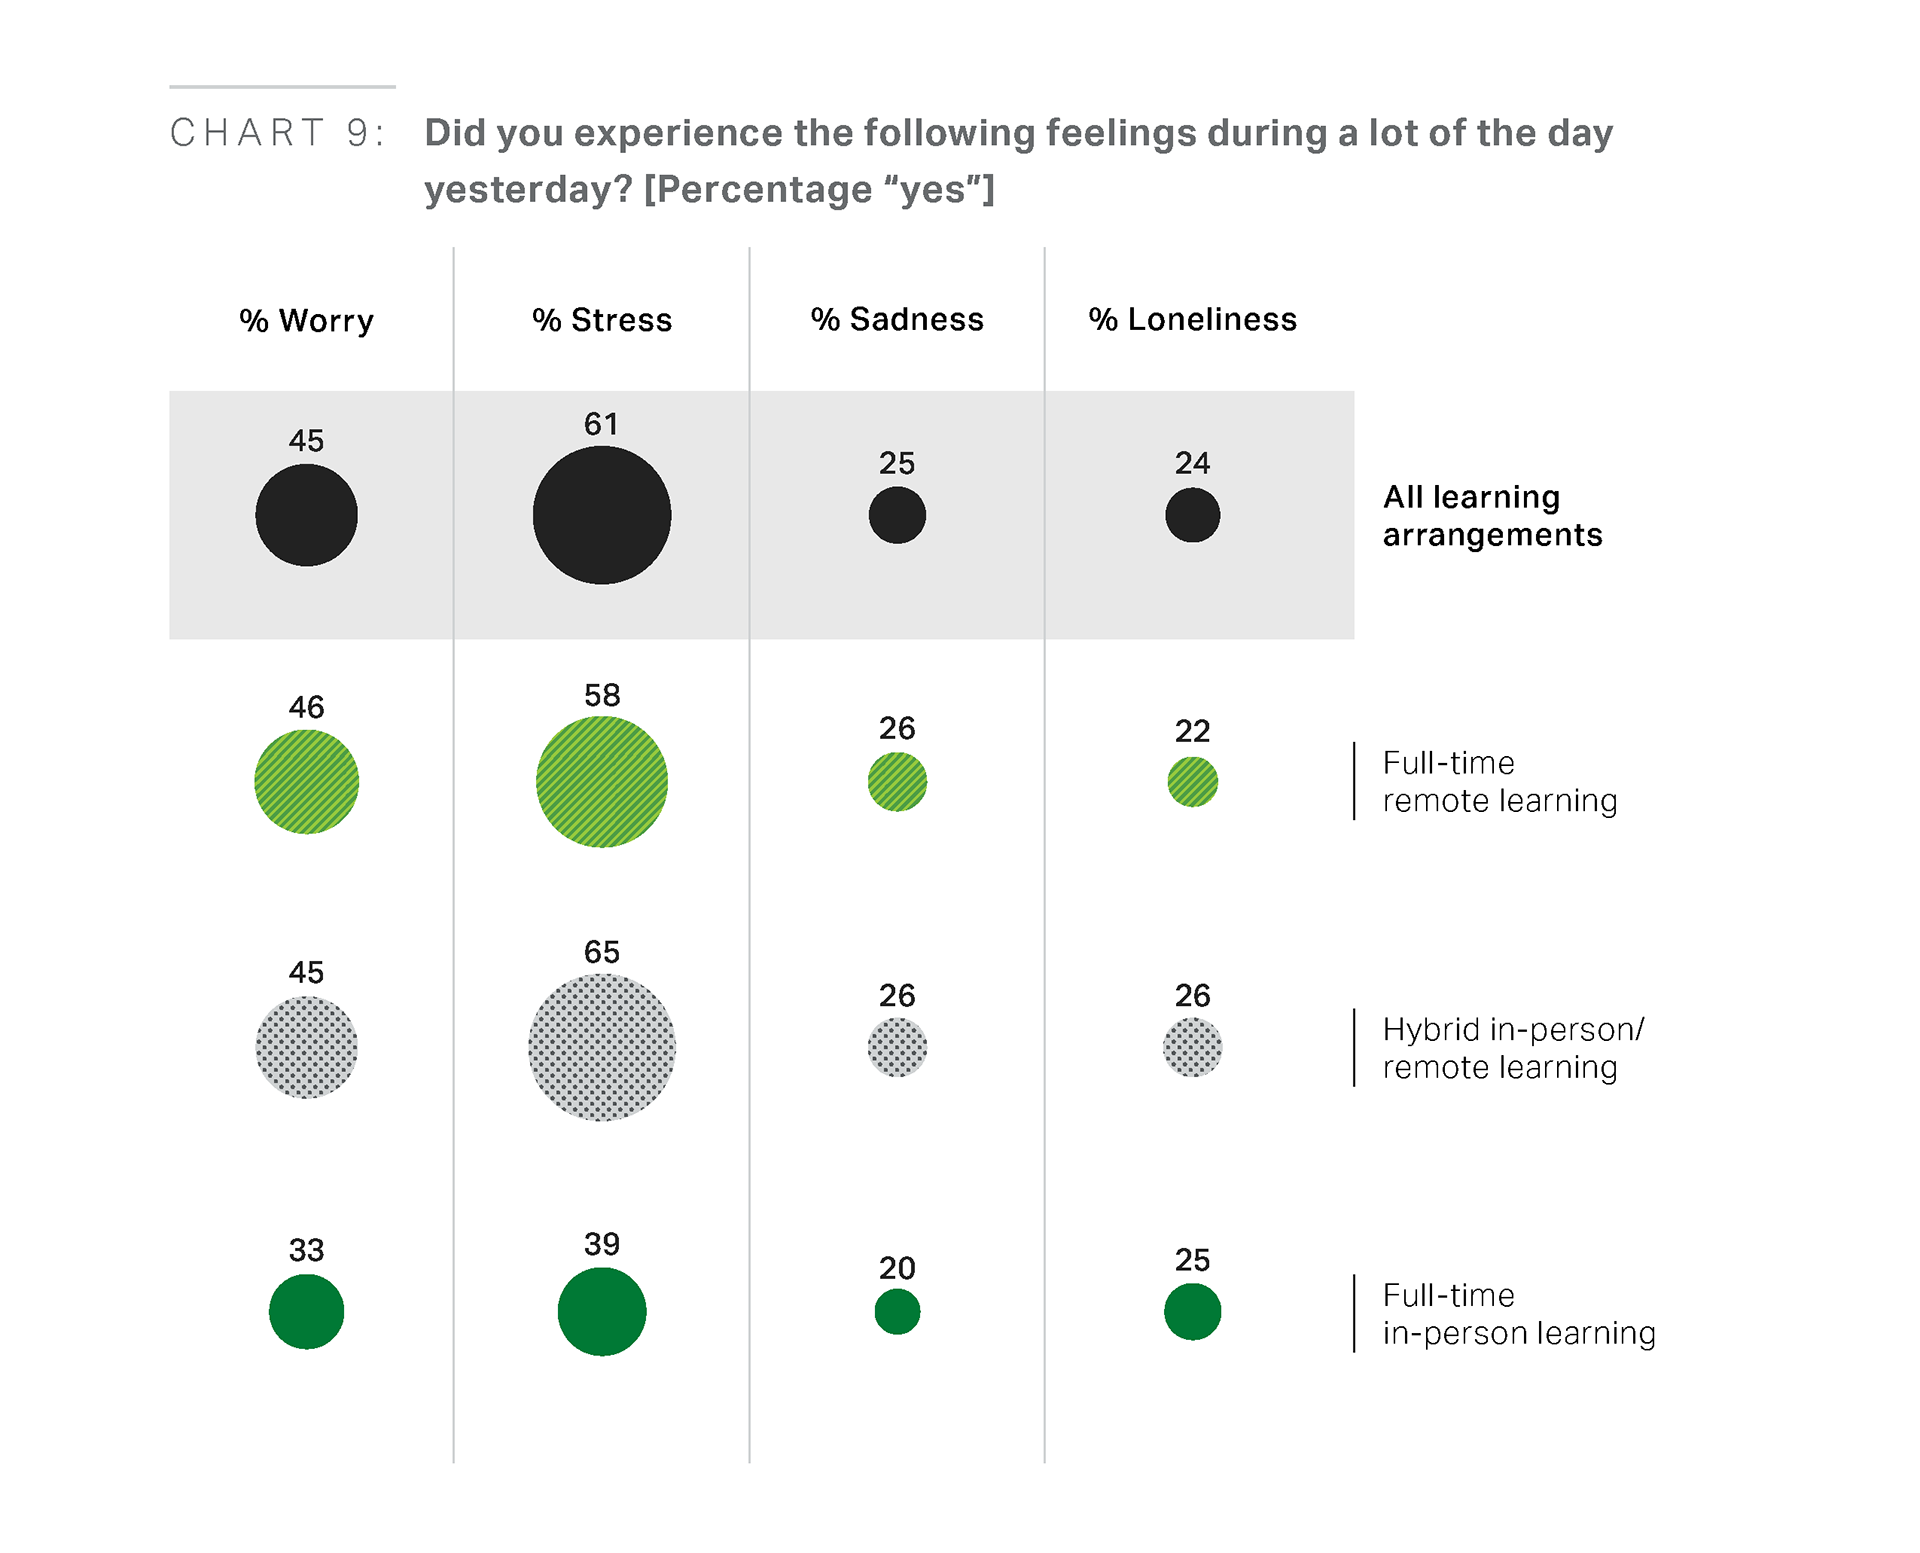
Barr Foundation Report
Distance and Disruption: Listening to Massachusetts Students During COVID-19



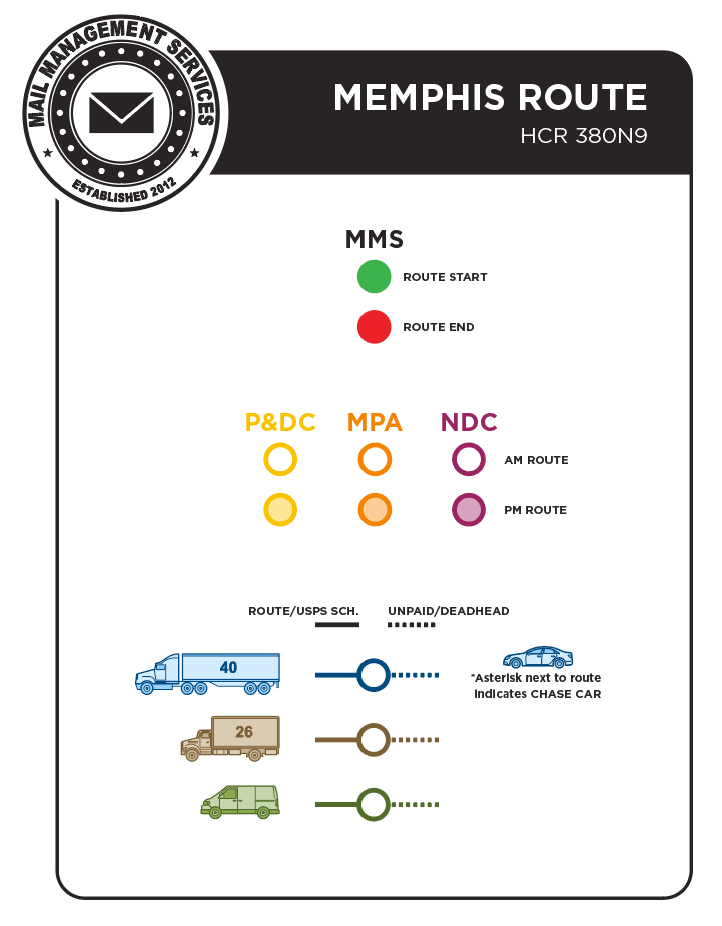
Mail Management Services
Delivery route infographics detailing times, cities, drop-off locations, vehicle types, frequencies and more.

